Hierarchical approvals let your manager know what people are trying to transfer
Monitor
Networking › Switching › Edge › Synapse
Overview
Select Monitor > Overview from the navigation tree to enter the overview page. As shown in Figure 2-1, The overview page is divided into 3 sections, namely "System Information", "Panel Port", and "Traffic".
In the "System Information" page, you can see the product ID, serial number, MAC address, hardware and software version of the device, the specific parameters are described as shown in Table 2-1.
Figure 2-1: Overview page
Table 2-1: Basic Information configuration items
Item
Description
Host Name
Displays the device name. Allows user to change it.
MAC Address
Displays the device’s MAC address.
Hardware Version
Displays the device’s hardware version.
Software Version
Displays the device’s software version.
Release Date
Displays the device software’s release date.
Product SN
Displays the device’s serial number.
CPU Used
Displays the device’s cpu status.
Memory Avail
Displays the device’s memory status.
System Uptime
Displays the time from last system start.
In the "Panel Ports" page, you can see the panel diagram of the device and the working conditions of the panel ports.
In the "Traffic" page, you can observe the traffic situation of the port.
Port Statistics
The port statistics module displays statistics about the packets received and sent through
interfaces.
Displaying port statistics
Select Monitor > Port Statistics in the navigation area to enter the page shown in Figure 2-2. The page displays the port’s Rx Load, Tx Load, Speed, Under size, Over size, CRC Error, Collision Count. Table 2-2 describes the items of port statistics.
Figure 2-2: port statistics page
Loop Protection
The “Loop Protection” page is used to display the working status of device loop-related protocols, such as ERPS and Spanning Tree protocols.
Select Monitor > Loop Protection in the navigation area to enter the loop protection status page, as shown in Figure 2-3.
You can see the working status of the ERPS and Spanning Tree Protocol that have been enabled, and the specific parameters can be described in the relevant sections of the protocol.
Click the ERPS Configuration and Spanning Tree Configuration buttons to directly switch to the relevant configuration interface.
Figure 2-3: Loop Protection status
Serial Server State
The "Serial Server State" page is used to display the working status of Serial Server.
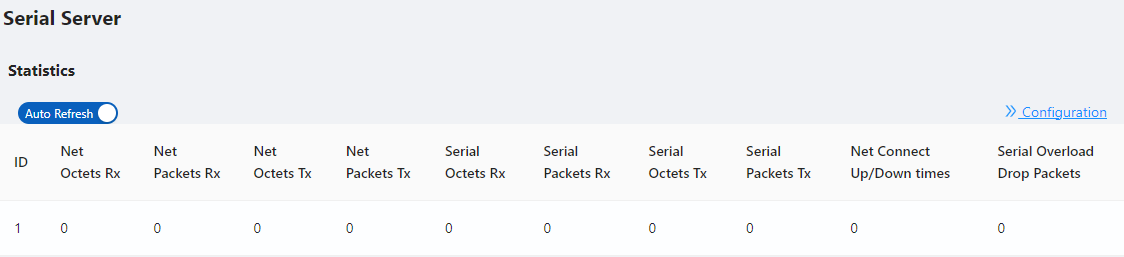
Select Monitor > Serial Server State in the navigation area to enter the Serial Server State page, as shown in Figure 2-4.
Figure 2-4: Serial Server status
In this page, you can see the working status of the serial server. Table 2-3 describes the items of port statistics.
Table 2-3: Items of Serial Server
Item
Description
ID
Serial port ID number of the serial port server
Net Octets Rx
The number of bytes received by the network
Net Packets Rx
The number of packets received by the network
Net Octets Tx
The number of bytes sent by the network
Net Packets Tx
The number of packets sent by the network
Serial Octets Rx
The number of bytes received by the serial port
Serial Packets Rx
The number of packets received by the serial port
Serial Octets Tx
The number of bytes sent by the serial port
Serial Packets Tx
The number of packets sent by the serial port
Net Connect Up/Down times
Number of network connections
Serial Overload Drop Packets
Number of packets discarded by serial port overflow
Click the Configuration button to directly switch to the relevant configuration interface.
Security
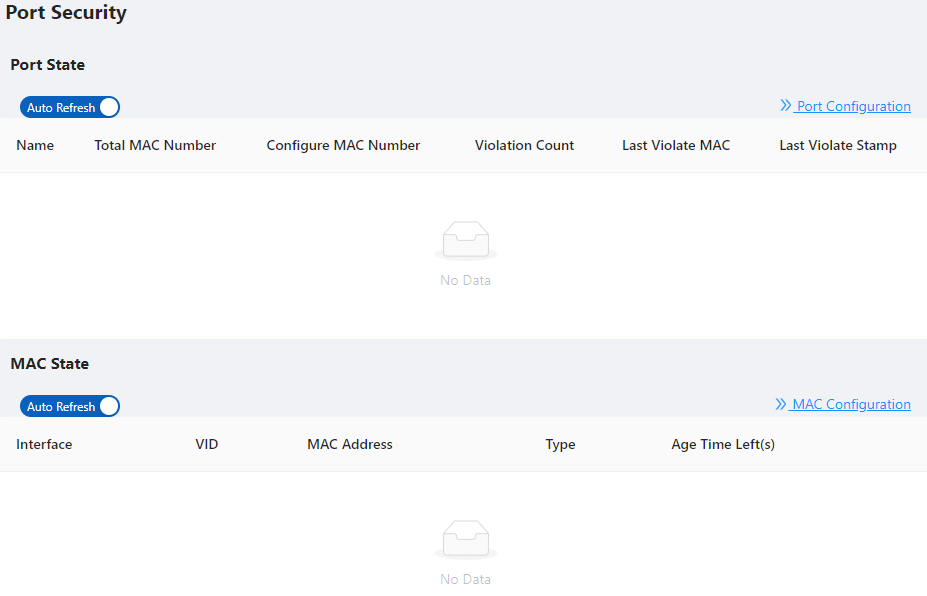
The "Security" page is used to display the working status of device security-related protocols, with three parts: port security, IP Source Guard, and MAC authentication.
Select Monitor > Security in the navigation area to enter the security display page, as shown in Figure 2-5, Figure 2-6, and Figure 2-7.
Figure 2-5: Port Security stateFigure 2-6: IP Source Guard stateFigure 2-7: MAC Auth state
In this page, you can see the working status of the ERPS, Spanning tree, IP Source Guard, and MAC authentication, and the specific parameters can be described in the relevant sections of the protocol.
Click the corresponding Configuration button to directly switch to the relevant configuration interface.
PoE State
The " PoE State" page is used to display the current PoE working status of the device. (1) Select Monitor > PoE State in the navigation bar to enter the PoE status page, as shown in Figure 2-8.
Figure 2-8: PoE State
(2) On the current page, you can see the total power supply of the device, the number of power supply ports, and the power supply status of each port. Specific parameter descriptions are shown in Table 2-4.
LLDP State
The LLDP Status page is used to display the device LLDP working status.
Select Monitor > LLDP State in the navigation area to enter the LLDP status page, as shown in Figure 2-9.
You can see the working status of the LLDP protocol that has been enabled in the page, and the specific parameters are described in the relevant sections of the protocol.
Click the LLDP Configuration button to directly switch to the LLDP configuration interface.
Figure 2-9: LLDP State
IGMP Snooping State
The "IGMP Snooping State" page is used to display the working status of the device IGMP Snooping protocol.
Select Monitor > IGMP Snooping State in the navigation area to enter the IGMP Snooping Status page, as shown in Figure 2-10.
You can see the working status of the IGMP Snooping protocol that has been enabled in the page, and the specific parameters can be described in the relevant sections of the protocol.
Click the IGMP Snooping Configuration button to directly switch to the IGMP Snooping configuration interface.
Figure 2-10: IGMP Snooping State
DHCP Snooping State
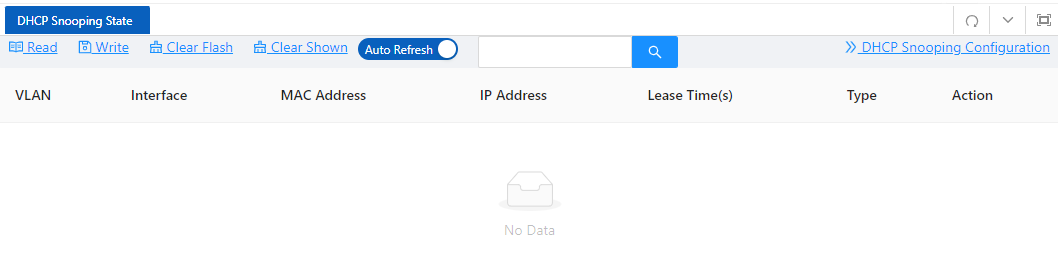
The “DHCP Snooping State” page is used to display the working status of the DHCP Snooping protocol of the device.
Select Monitor > DHCP Snooping State in the navigation area to enter the DHCP Snooping state page, as shown in Figure 2-11.
You can see the working status of dhcp Snooping protocol that has been enabled in the page, and the specific parameters can be described in the relevant sections of the protocol.
Click the DHCP Snooping Configuration button to directly switch to the DHCP Snooping configuration interface.
Figure 2-11: DHCP Snooping State
QinQ Information
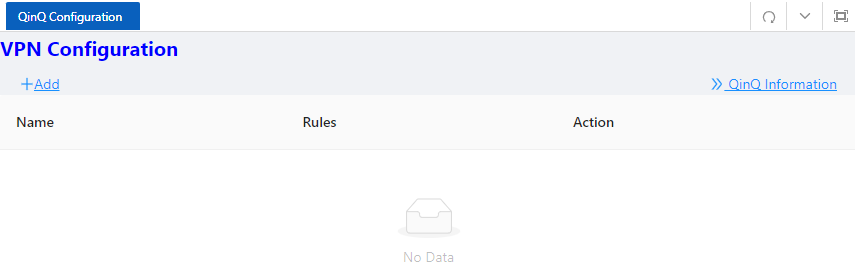
The "QinQ Information" page is used to display the working status of the device QinQ information.
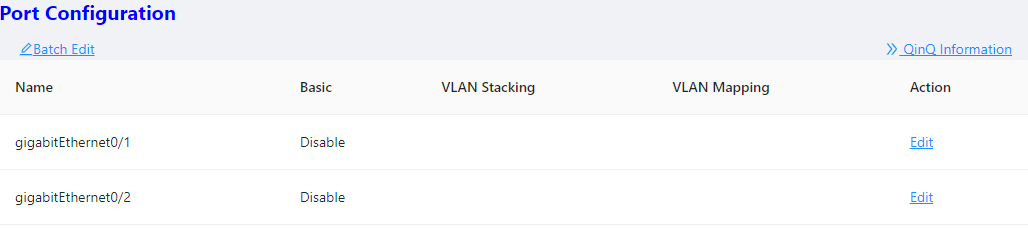
Select Monitor > QinQ Information in the navigation area to enter the QinQ status page, as shown in Figure 2-12.
You can see the working status of QinQ that has been turned on in the page, and the specific parameters can be described in the relevant sections of the protocol.
Click the QinQ Configuration button to quickly switch to the QinQ configuration interface.
Figure 2-12: QinQ Information
LoopDetect State
The "LoopDetect State" page is used to display the working status of the loop.
Select Monitor > LoopDetect State in the navigation area to enter the LoopDetect status page, as shown in Figure 2-13.
You can see the working status of loop detection that has been turned on in the page, and the specific parameters can be described in the relevant sections of the protocol.
Click the LoopDetect Configuration button to quickly switch to the loopdetect configuration interface.
Figure 2-13: LoopDetect State
ARP Information
The "ARP Information" page is used to display the working status of the device ARP information.
Select Monitor > ARP Information in the navigation area to enter the ARP status page, as shown in Figure 2-14.
You can see the working status of ARP that has been turned on in the page, and the specific parameters can be described in the relevant sections of the protocol.
Click the Static ARP button to quickly switch to the static ARP configuration interface.